United States
To Optimize The Locations Of New Groundwater Monitoring Wells At A Federal Aviation Administration (FAA) Project Site, Trc Implemented An Innovative Modeling And Visualization Approach Leveraging The Power Of 3d Volumetric Technology.
Challenge
Gaining an in depth understanding of the extent and complexity of tetrachloroethylene (PCE) groundwater plume at this FAA location was critical to determining the most effective placement of nine proposed groundwater monitoring wells. Our team used C Tech’s Earth Volumetric Studio (EVS) software to develop a unique, three-dimensional (3D) visualization model of the PCE groundwater plume. Using 218 discrete depth groundwater samples from 63 soil borings, our EVS model supported more informed project decision making and in-field execution.
Data Inputs and Model Construction Methods
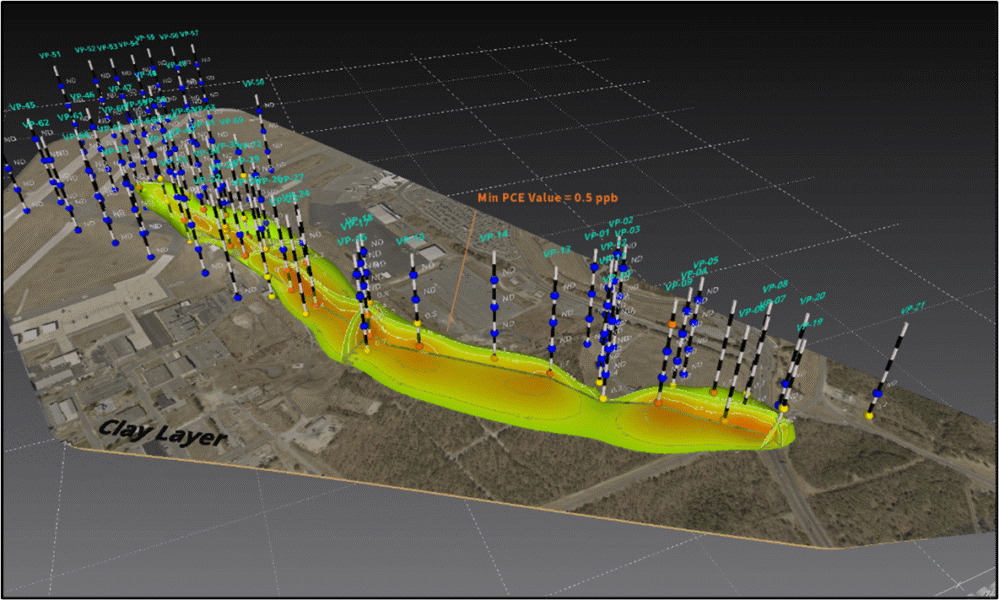
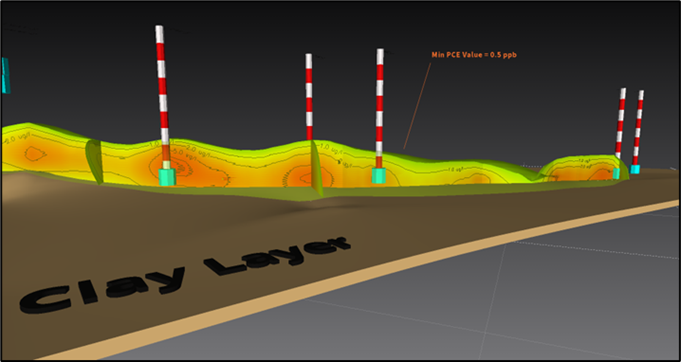
Using available CAD and GIS data, we incorporated site topography and site features directly into the EVS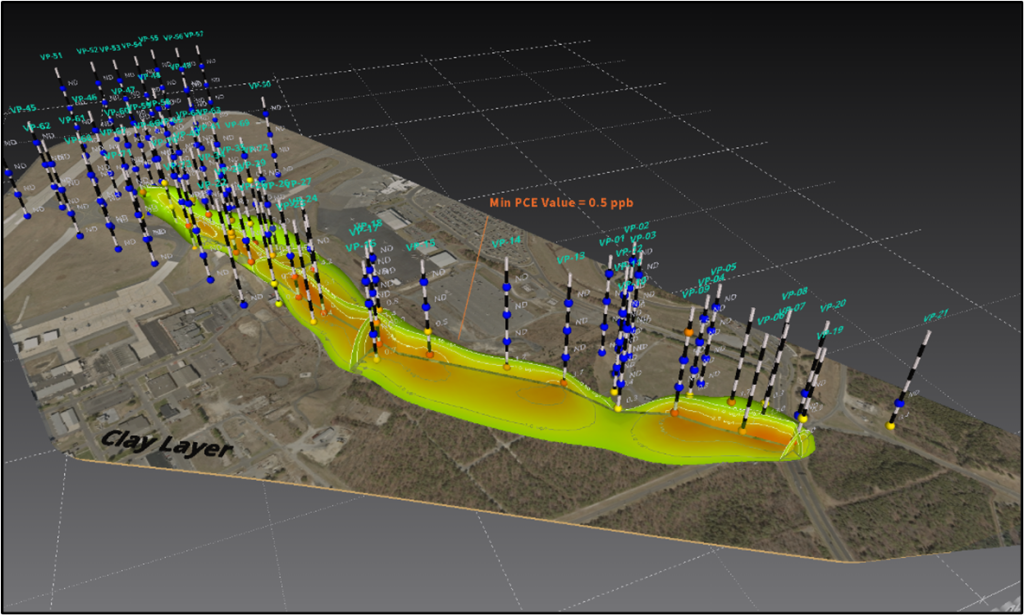 model’s 3D space. Geologic and hydrogeologic information from individual borings were interpolated using a Natural Neighbors algorithm to create a continuous 3D geologic and hydrogeologic representation of the site. At the subject site, contaminants in groundwater were confined above a regional clay layer. The regional clay layer, shown in the image above, was used as the bottom of the model.
Available geologic, hydrogeologic and analytical data collected at the site during historical investigations were compiled to develop Analyte Point Data (.apdv) input files for EVS. The .apdv file format was chosen over the Analyte Interval Data (.aidv) file format due to the amount and short length of sample intervals. The .aidv file format is preferred when interpolating data over a large interval.
The modeling of the PCE plume and the minimum concentration values can be controlled by the EVS user and are typically set to a clean-up goal or regulatory screening level. For this site, the minimum PCE concentration value was set to 0.5 micrograms per liter (µg/L).

Managing Dense Data
To most accurately represent the site sample data, which was fairy dense both vertically and laterally, we utilized EVS’s Data Reduction Tool. High density sample spacing can often result in a rough, blocky plume when imported into EVS. Examples include sites where data was collected using continuous direct-sensing methods such as Cone Penetrometer Testing or a Membrane Interface Probe.
The Data Reduction Tool utilizes complex algorithms to minimize redundant data and reduce noise. The reduction tool has different methods of reduction based on the type and quantity of data being used. Available reduction methods include Gradient Optimization, Average of Geometric Centroid, Extremes of Samples and Min/Max of Samples. Maximizing use of this feature results in smoother interpolations and quicker processing times while still honoring the original sample data. Using gradient optimization, we reduced the total number of samples used in the plume interpolation resulting in a smoother and improved plume visualization.
The images below show the source area of the PCE plume before and after applying the Data Reduction Tool.
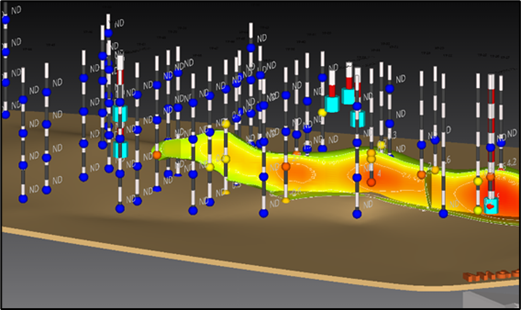
Before the Data Reduction Tool was applied, the plume was discontinuous and blocky which did not accurately represent the sample data or plume.
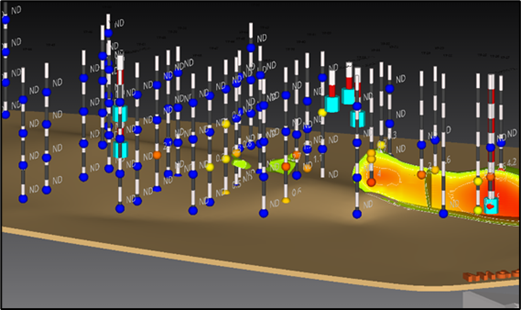
After the Data Reduction Tool was applied, the plume was smoother and improved the visual representation of the analytical data.
Results
Based on the analysis of the PCE plume, optimal locations were determined for the proposed monitoring wells. 3D visualizations improve the lateral selection of well locations and are highly effective in the selection of optimal well depths and screen intervals. Additionally, we applied an uncertainty analysis to the available data within EVS to further assist in identifying data gaps and allowing more informed project decisions. Proposed locations can also be simulated with various “dummy” values to help the project team prepare for scenarios and adjustments during field execution. EVS can support the field teams in a pseudo real-time fashion as data is obtained to better inform and streamline field decisions.
After the plume analysis was completed the locations of nine proposed wells were selected.
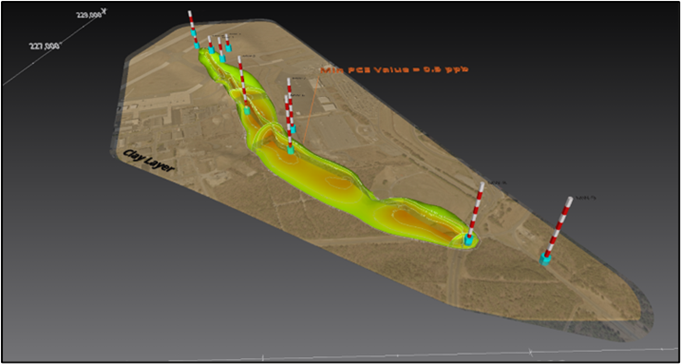
The use of 3D visualizations allows for informed decisions to be made regarding proposed monitoring
well depths and screen intervals. The well casings are represented by the red/white tubes and the
proposed screen intervals are represented by the blue cylinders.
TRC Can Help
Mike Sellwood, PG is a Senior Project Geologist in the Rancho Cordova, California office and has been using EVS for 3D visualizations for over 10 years. Mike is also a member of the Hydrogeology Modeling and Visualization (HMV) CORE Team. The Center of Research and Expertise (CORE) is a national, multidisciplinary team of TRC experts dedicated to advancing and disseminating technical, regulatory, and strategic knowledge, and enhancing and sustaining TRC’s leadership position. TRC and the HMV CORE Team have subject matter experts in 3D visualization modeling and groundwater flow modeling that can assist with a variety of applications including risk assessments, remedial designs, water management, and litigation support projects. Please reach out to Mike at MSellwood@trccompanies.com with any questions or potential project opportunities.